As one of the key services we offer, we decided to look into service of process and identify where the majority serves are occurring and originating from in the Inland Empire. Using some of our historical data as well as data from other sources, we were able to examine the geographic spread of process service in two major counties: San Bernardino and Riverside. The below heatmaps and tables illustrate this data. We took a random sampling of over 3,000 attempts and display both the highest concentration of service attempts as well as the originating courts.
Service Attempts in San Bernardino and Riverside Counties
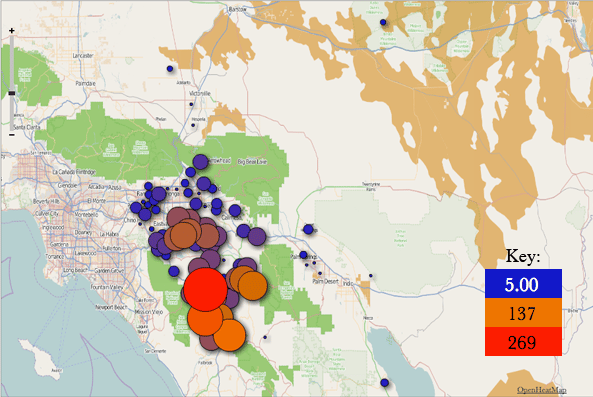
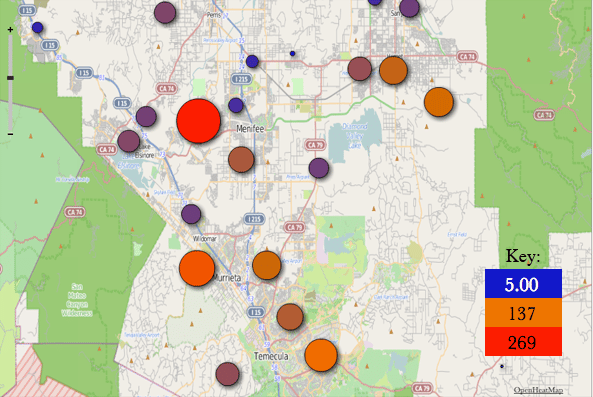
The maps below illustrate the concentration of service attempts across the two counties and a closer look at the highest concentration area. A table of the data used to generate the maps is also included.
Map of Service Attempts in San Bernardino and Riverside Counties 
Covering 7,303 square miles of land and a population of 2,189,641, Riverside County has a denser population spread than San Bernardino County (its population of 2,035,210 is spread across 20,105 square miles, more than two and a half times the size of neighboring Riverside). This could account for the lower concentration of service attempts by zip code in San Bernardino county, which includes 115 more zip codes than Riverside County.
Highest Concentration of Service Attempts in San Bernardino and Riverside Counties
As the largest city in Riverside County, it’s no surprise that the eight of the 15 zip codes that make up Riverside (city) combine to make up 544 of the recorded service attempts. However, Quail Valley had the highest concentration in a single zip code with 269 service attempts.
Data: Service Attempts in San Bernardino and Riverside Counties
Based on data from Bosco Legal and other sources, the below table outlines the concentration of service attempts in San Bernardino and Riverside Counties.
| City | Zip Code | Number of Attempts |
|---|---|---|
| Adelanto | 92301 | 9 |
| Aguanga | 92536 | 5 |
| Banning | 92220 | 5 |
| Beaumont | 92223 | 30 |
| Cathedral City | 92234 | 6 |
| Chino | 91708 91710 | 8 26 |
| Chino Hills | 91709 | 6 |
| Colton | 92324 | 24 |
| Corona | 92879 92880 92881 92882 92883 | 44 43 15 32 20 |
| Crestline | 92325 | 36 |
| Desert Hot Springs | 92240 | 17 |
| Fontana | 92336 | 5 |
| Hemet | 92543 92544 92545 | 111 121 81 |
| Hesperia | 92345 | 5 |
| Highland | 92346 | 15 |
| Homeland | 92548 | 8 |
| Lake Elsinore | 92530 92531 92532 | 69 5 60 |
| Loma Linda | 92354 | 6 |
| Menifee | 92584 | 94 |
| Montclair | 91763 | 7 |
| Moreno Valley | 92551 92553 92555 92557 | 58 103 58 67 |
| Murrieta | 92562 92563 | 177 115 |
| Norco | 92860 | 24 |
| Nuevo | 92567 | 5 |
| Ontario | 91761 91762 91764 | 14 11 18 |
| Palm Springs | 92262 92264 | 12 5 |
| Perris | 92570 92571 | 67 60 |
| Pomona | 91766 | 22 |
| Quail Valley | 92587 | 269 |
| Rancho Cucamonga | 91701 91730 91739 | 9 33 5 |
| Rancho Mirage | 92270 | 5 |
| Redlands | 92374 92373 | 20 18 |
| Rialto | 92376 92377 | 15 13 |
| Riverside | 92501 92503 92504 92505 92506 92507 92508 92509 | 75 92 101 18 96 49 35 78 |
| Salton City | 92275 | 13 |
| San Bernardino | 92404 92407 92410 92415 | 31 18 5 9 |
| San Jacinto | 92582 92583 | 31 57 |
| Sun City | 92585 92586 | 25 34 |
| Temecula | 92590 92591 92592 | 78 99 148 |
| Upland | 91784 91786 | 13 14 |
| Victorville | 92392 | 5 |
| Wildomar | 92595 | 55 |
| Winchester | 92596 | 58 |
| Yucaipa | 92399 | 24 |
Originating Courts in San Bernardino and Riverside County Serves
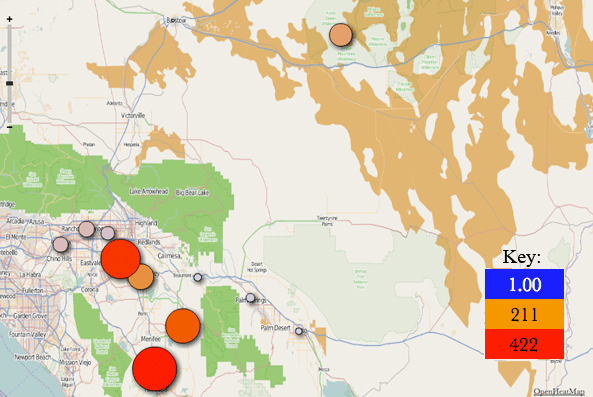
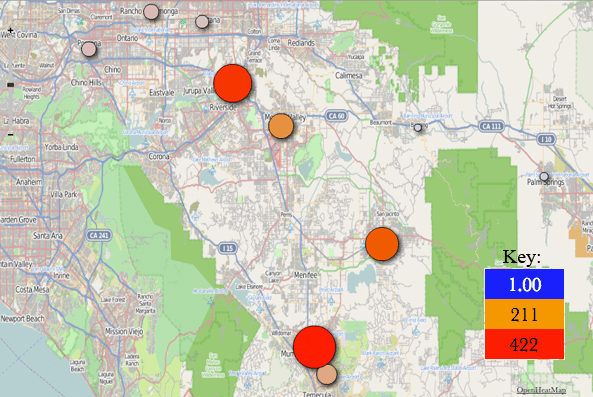
As with service attempts, the maps below illustrate the concentration of originating courts across the two counties, including a closer look at the highly concentrated areas. The complete data is also outlined in a table.
Map of Originating Courts for San Bernardino and Riverside County Serves
Hemet, Murrieta, and Riverside accounted for the three highest totals of serves, with 259, 422, and 347 respectively. The map is a little more balanced between the two counties as far as highest concentration per zip code.
Highest Concentration of Originating Courts for San Bernardino and Riverside County Serves
Southwest Justice Center, located in Murrieta (one of the four most populated cities in Riverside County), saw the highest number of originating papers in one zip code: 422. Four zip codes in Riverside (the most populated city in that county) accounted for 347, with the Riverside Superior Court as the state trial court for that county.
Data: Originating Courts for San Bernardino and Riverside County Serves
Using data from Bosco Legal and other sources, the below table outlines from which courts most serves originate in San Bernardino and Riverside Counties.
| City | Zip Code | Number of Originating Serves |
|---|---|---|
| Banning | 92220 | 13 |
| Barstow | 92311 | 2 |
| Blythe | 92225 | 1 |
| Fontana | 92335 | 40 |
| Hemet | 92543 | 259 |
| Indio | 92201 | 10 |
| Moreno Valley | 92553 | 146 |
| Murrieta | 92563 | 422 |
| Palm Springs | 92262 | 17 |
| Pomona | 91766 | 51 |
| Rancho Cucamonga | 91730 92416 | 70 1 |
| Riverside | 92501 | 341 |
| San Bernardino | 92415 | 113 |
| Temecula | 92591 | 97 |
Correlations in Data
Shown as the most frequent originating court and listed 422 times, only 232 service attempts were made in Murrieta (about 55% of the amount originating from that location). Hemet, listed as the originating court in 259 instances, was the site of 313 total service attempts. Quail Valley, the zip code with the highest concentration of service attempts, does not have its own courthouse, but for certain cases filing is to be done at the historic Riverside courthouse. Riverside was listed as the originating court for 347 serves, which means that Quail Valley serves could have accounted for over 75% of the attempts originating from that court.
Conclusion
While the above data and heat maps do show concentration based on zip code, it is important to consider population density, multiple attempts for the same service, and other factors that can influence that data.


